The good news is a rebound is on the cards. Short term stochastics is near the low end of its range and 21-day RSI is turning up from near neutral levels. ADX has flattened, and the DIs are looking to turn neutral from negative stances. These indicators should be sufficient to provide the STI with a fillip in the new year.
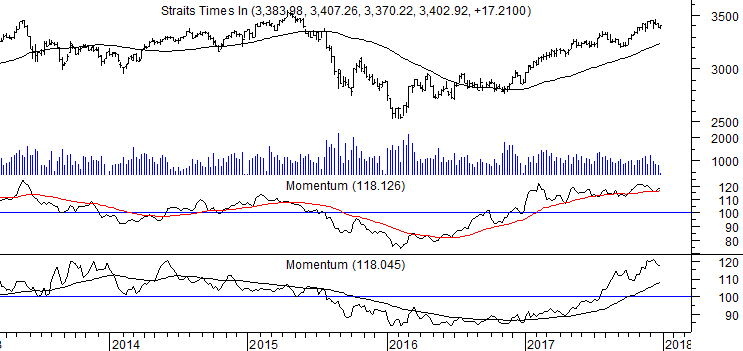
On the other hand, quarterly momentum is losing steam and is clearly struggling to stay above its own support line.
STI (daily, short term indicators)
Annual momentum is also struggling. It continues to test its own weighted moving average which has acted as a support line for the past 18 months. If annual momentum breaks down, it would have done so after a negative divergence with the index. This hasn’t materialised, but the indicator should be watched closely.
For now, the continuation pattern remains intact. The lower boundary has been established at 3,341 and the upper boundary at 3,449. The 50-day moving average is still rising, and is at 3,403. The STI needs to move above this to be able to get back to the upper boundary.
STI (weekly, long term indicators)
STI (weekly, long term indicators) 


